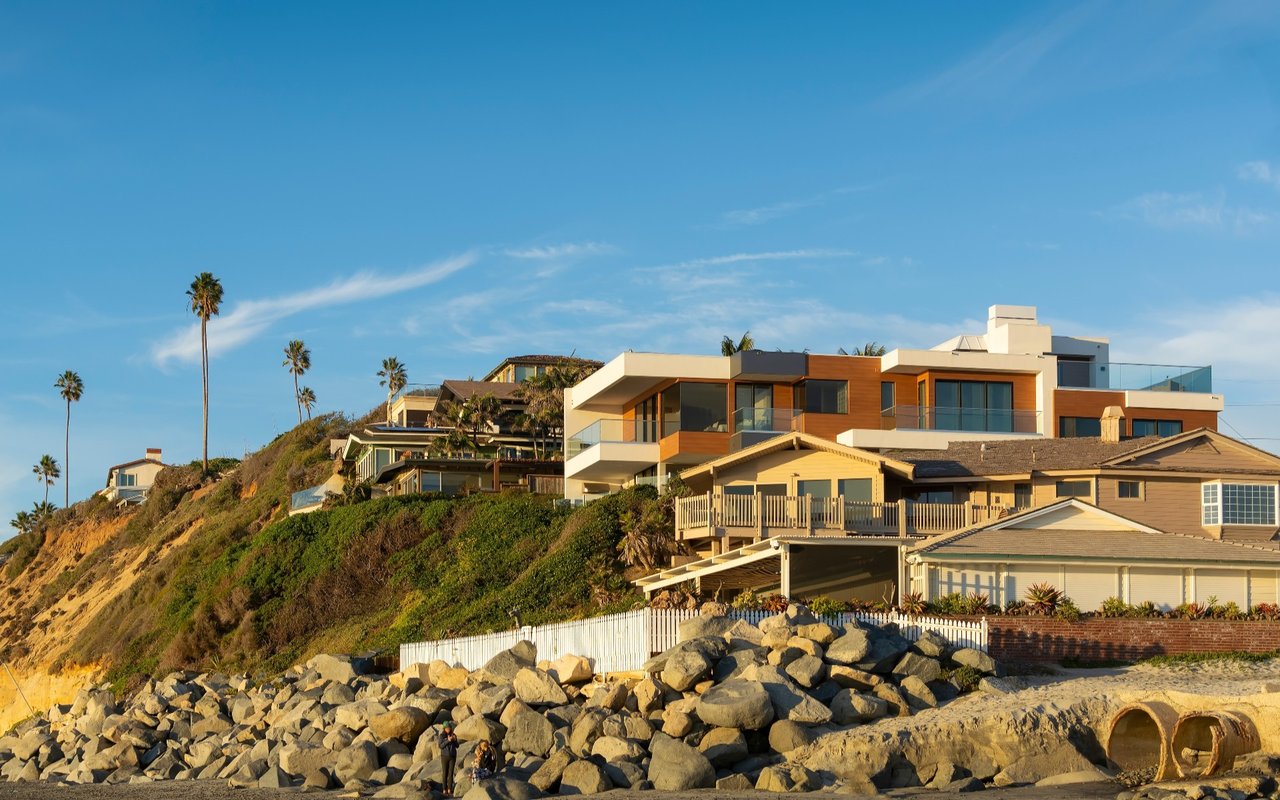
Coastal homes above a rocky shoreline, with a modern residence and palm trees on the bluff.

Encinitas Market Report February 2026

  • Sonja Huter
  • February 16, 2026
 

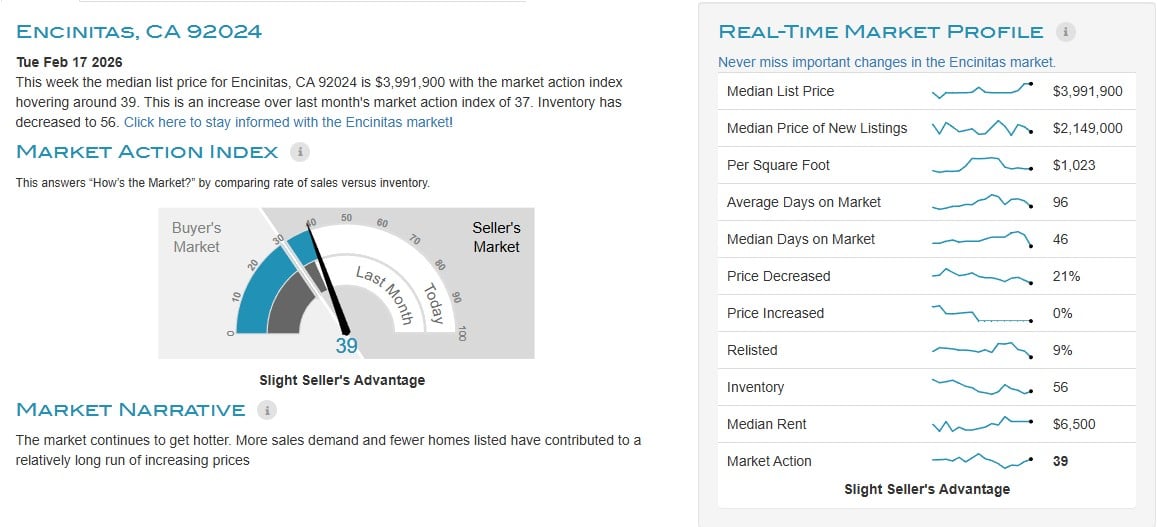
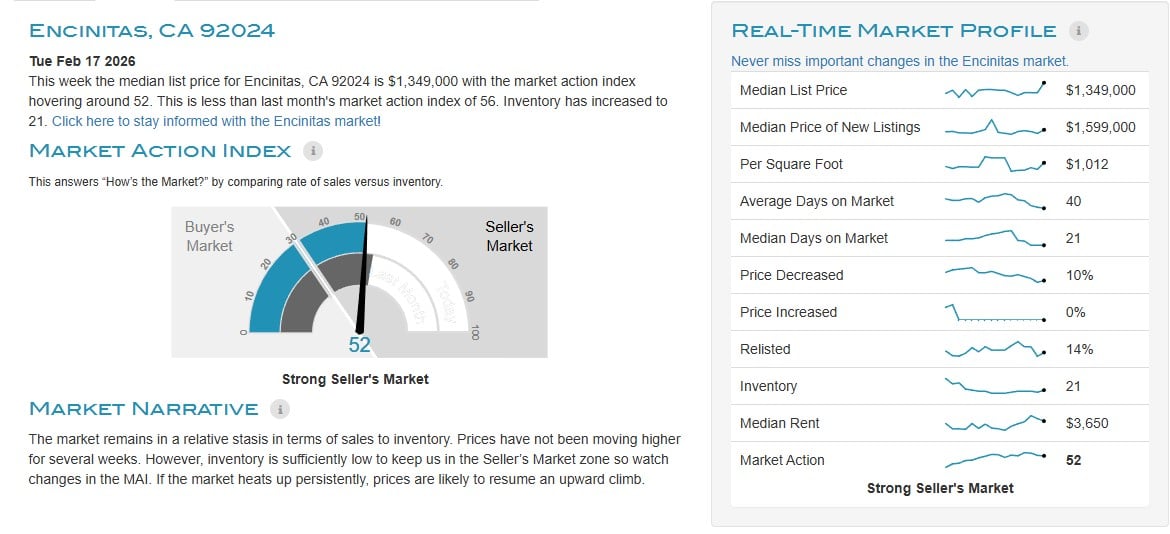
Encinitas market report infographic with a market action index of 52 and real-time housing statistics.

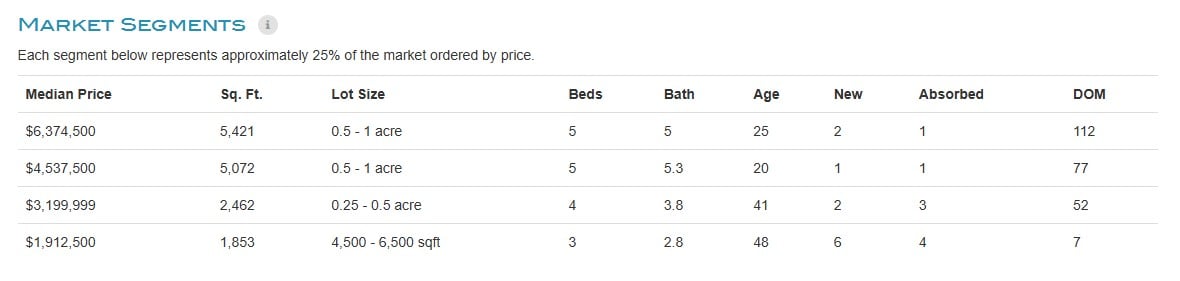
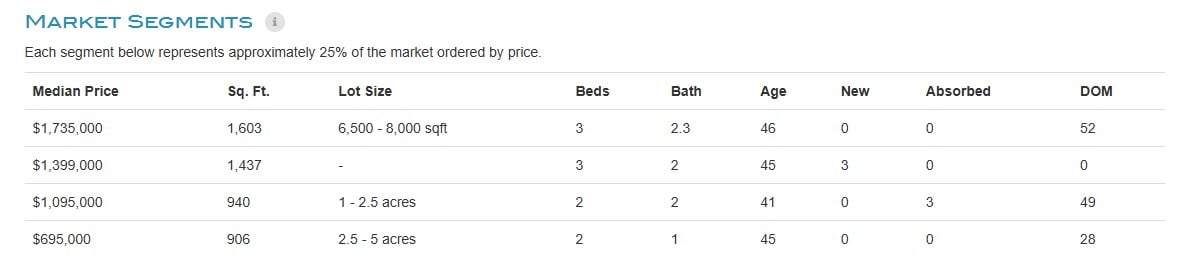
Encinitas market segments table comparing median prices, home sizes, lot sizes, beds, baths, and days on market.


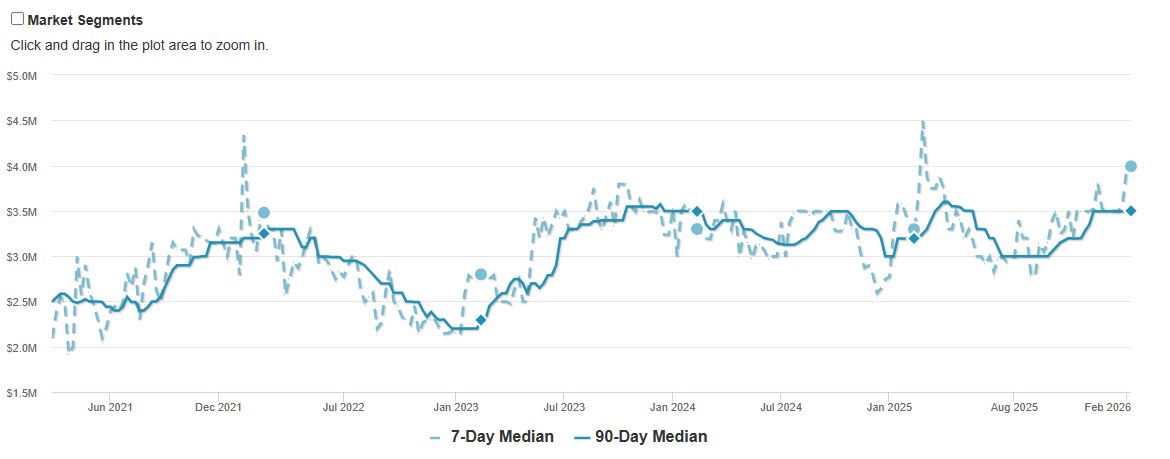
Encinitas price trend chart comparing 7-day and 90-day medians from 2021 to February 2026.
 
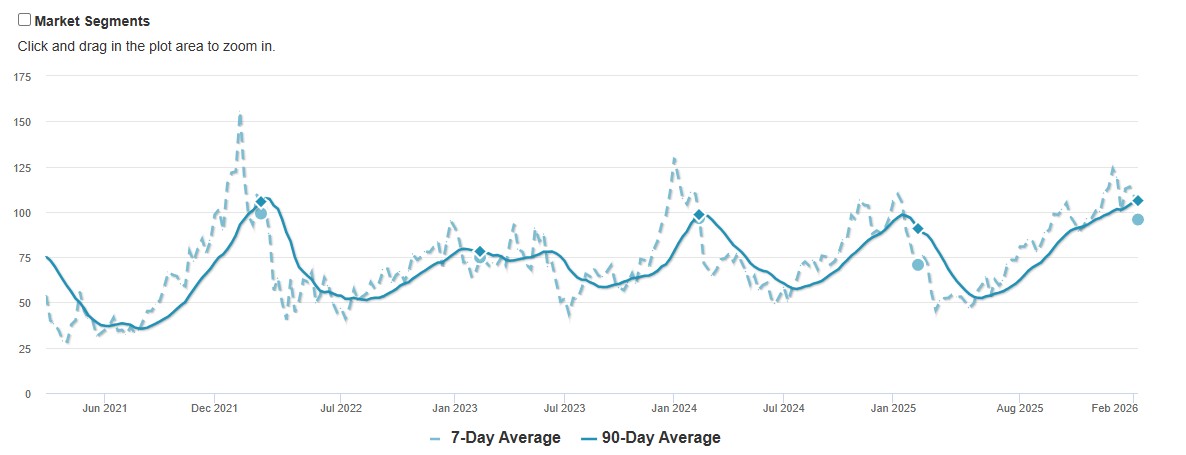
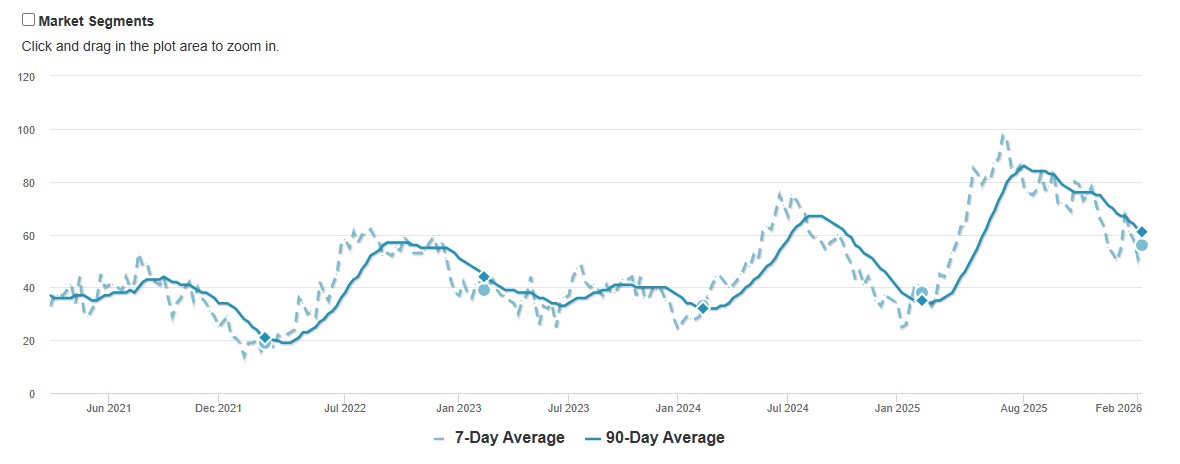
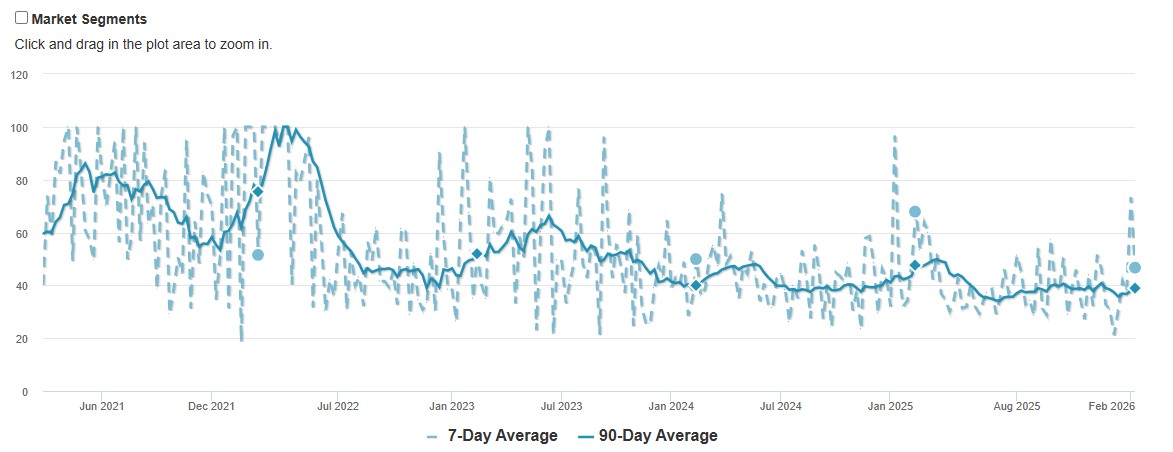
Line chart comparing 7-Day and 90-Day averages from 2021 to February 2026, ending near 100.
 
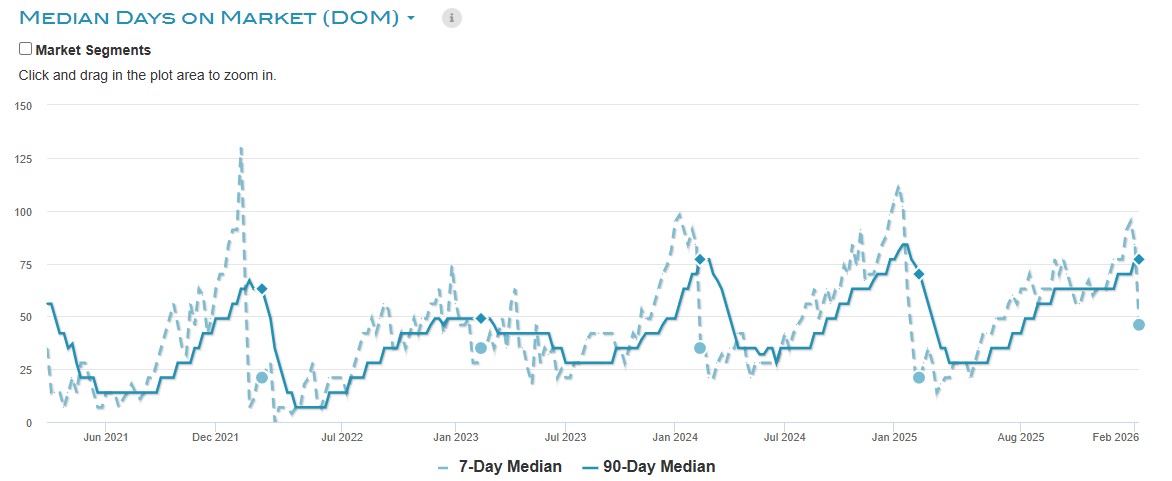
Encinitas median days on market, 2021–February 2026, comparing 7-day and 90-day medians.
 
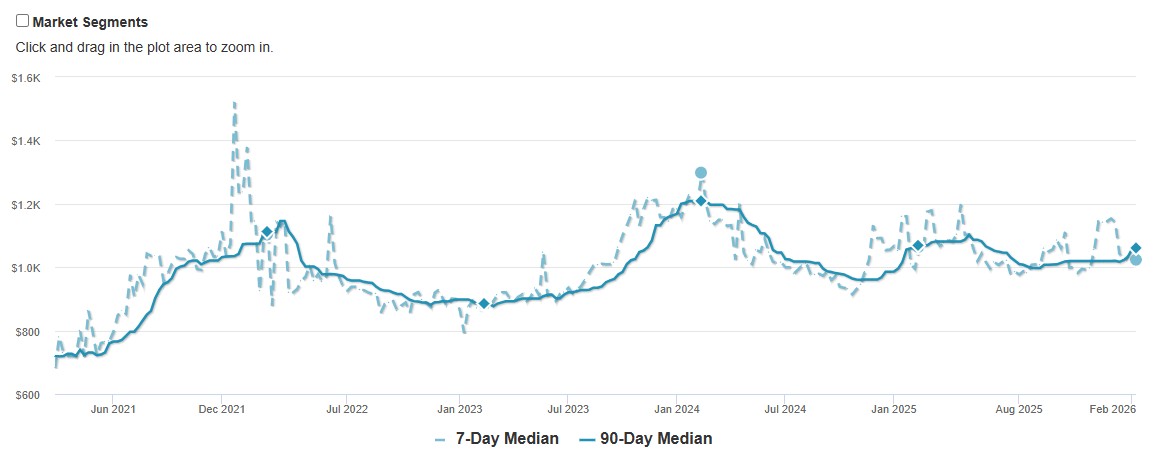
Market Segments chart compares 7-Day and 90-Day Median values from 2021 to February 2026.
 
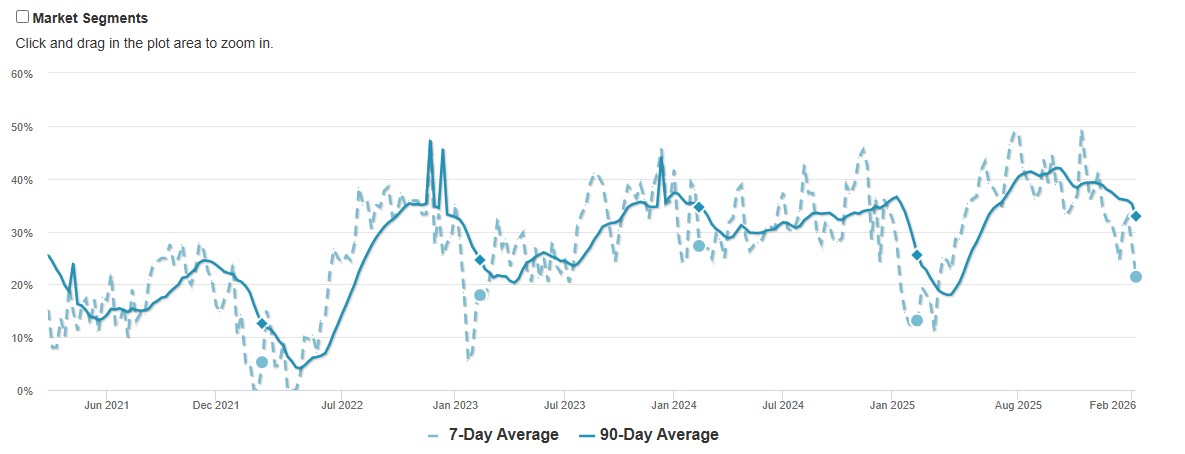
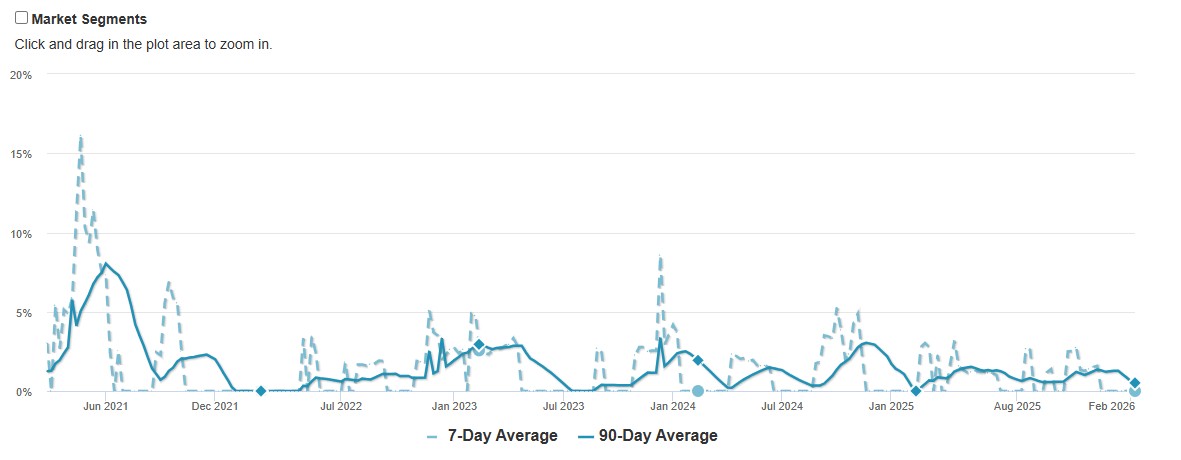
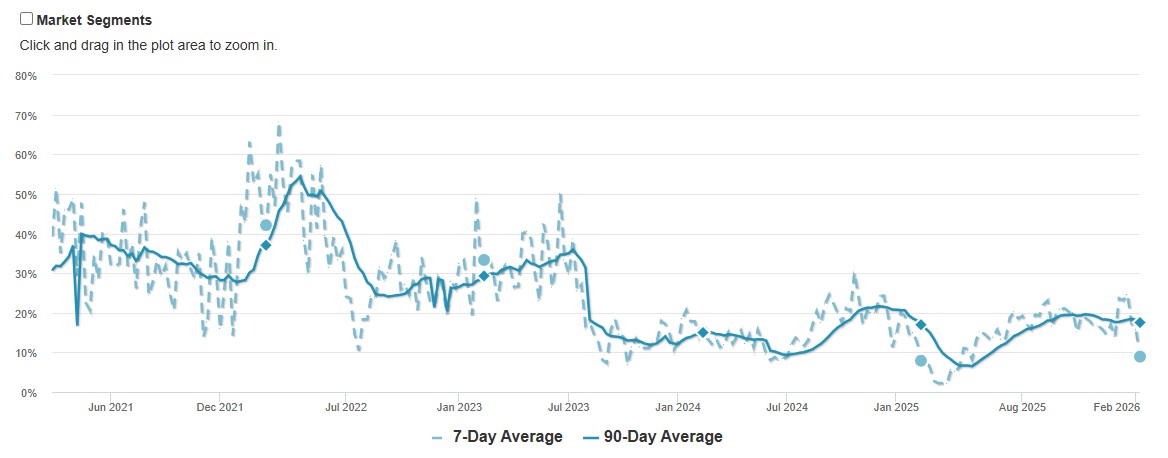
Market segment percentage trends from 2021 to February 2026, shown as 7-day and 90-day averages.
 
Line chart comparing 7-day and 90-day averages, with percentage values from June 2021 to February 2026.
 
Line chart comparing 7-day and 90-day averages from 2021 to February 2026, on a 0%–80% scale.
 
Line chart comparing 7-day and 90-day averages from 2021 to February 2026, with a peak in 2025.

Chart comparing 7-day and 90-day averages from June 2021 to February 2026.

Work With Sonja

Whether you are looking to sell your home, buy a home or learn about the prestigious communities of Rancho Santa Fe, La Jolla and Del Mar, Sonja Huter’s expertise in the San Diego real estate market is like no other real estate agent in the area.
Follow Sonja