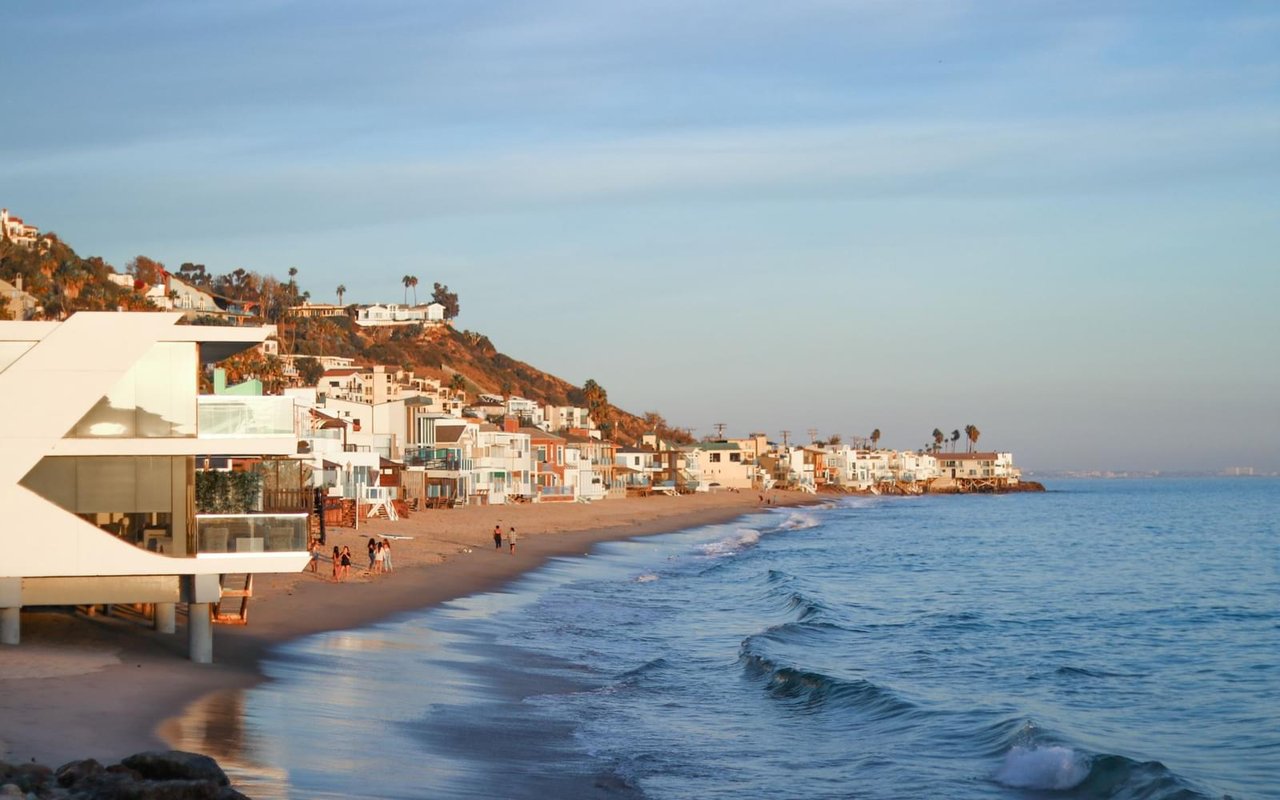
Solana Beach shoreline with beachfront homes and waves in warm evening light.

Solana Beach Market Report March 2026

  • March 24, 2026
 

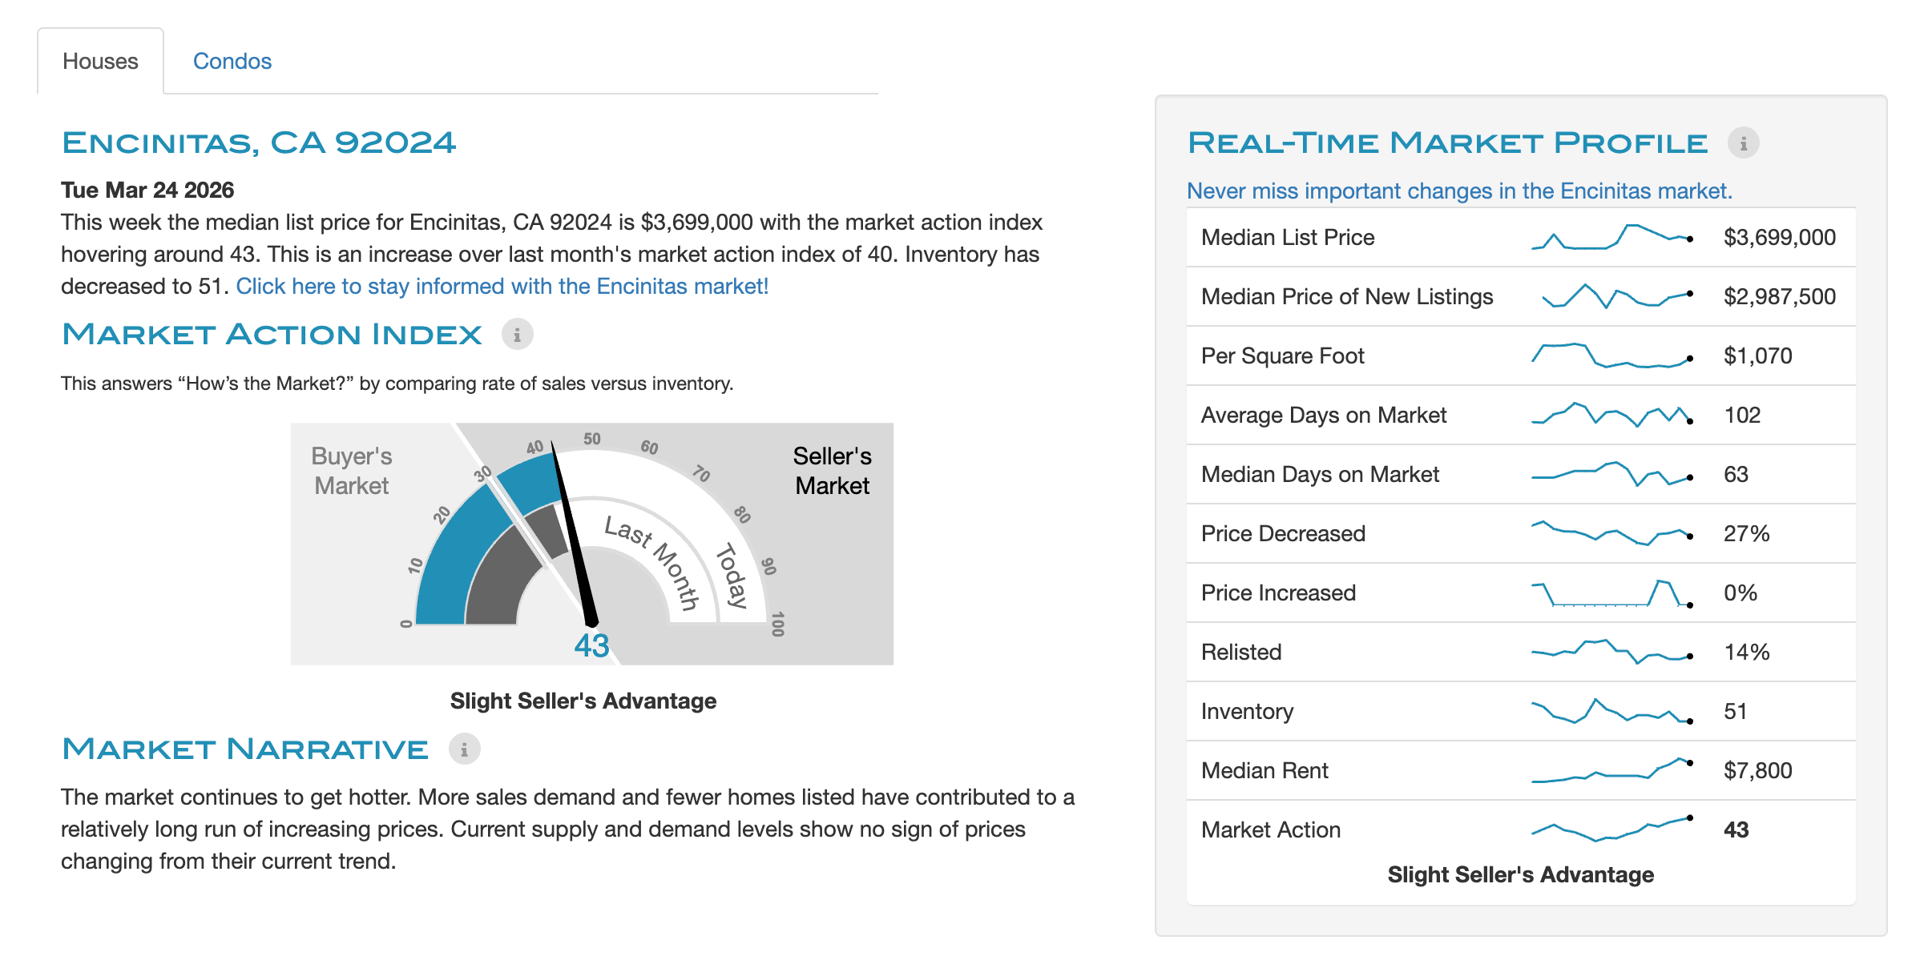
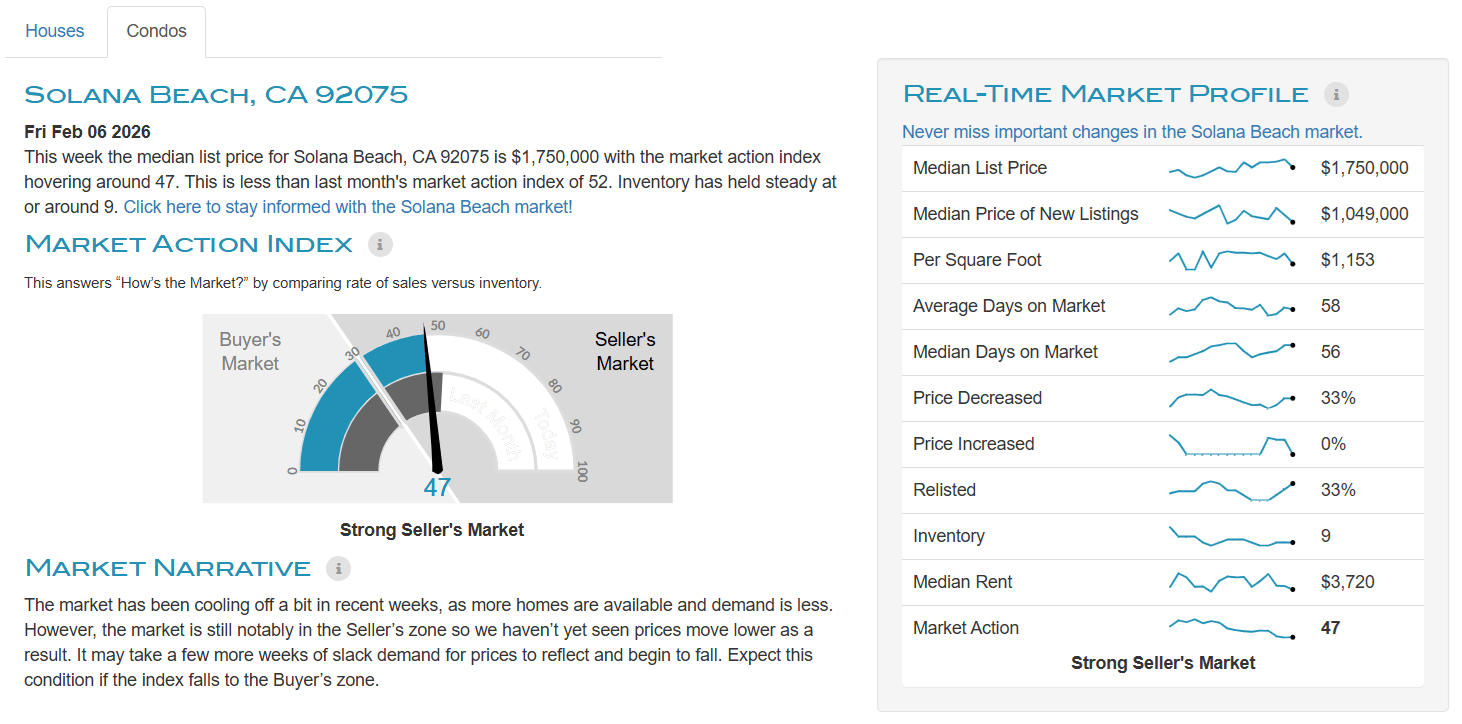
Solana Beach market report showing a market action index of 47 and real-time housing statistics.

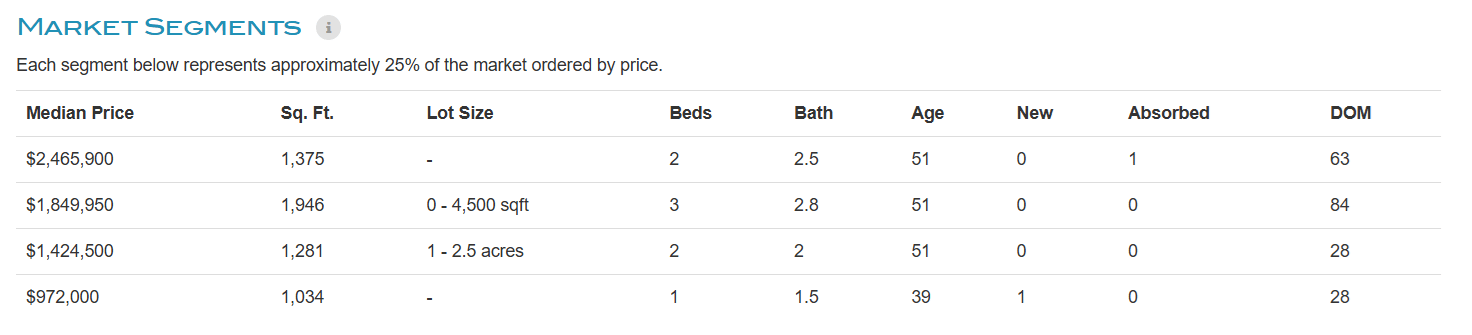
Market segments table comparing prices, home features, new and absorbed listings, and days on market across four groups.


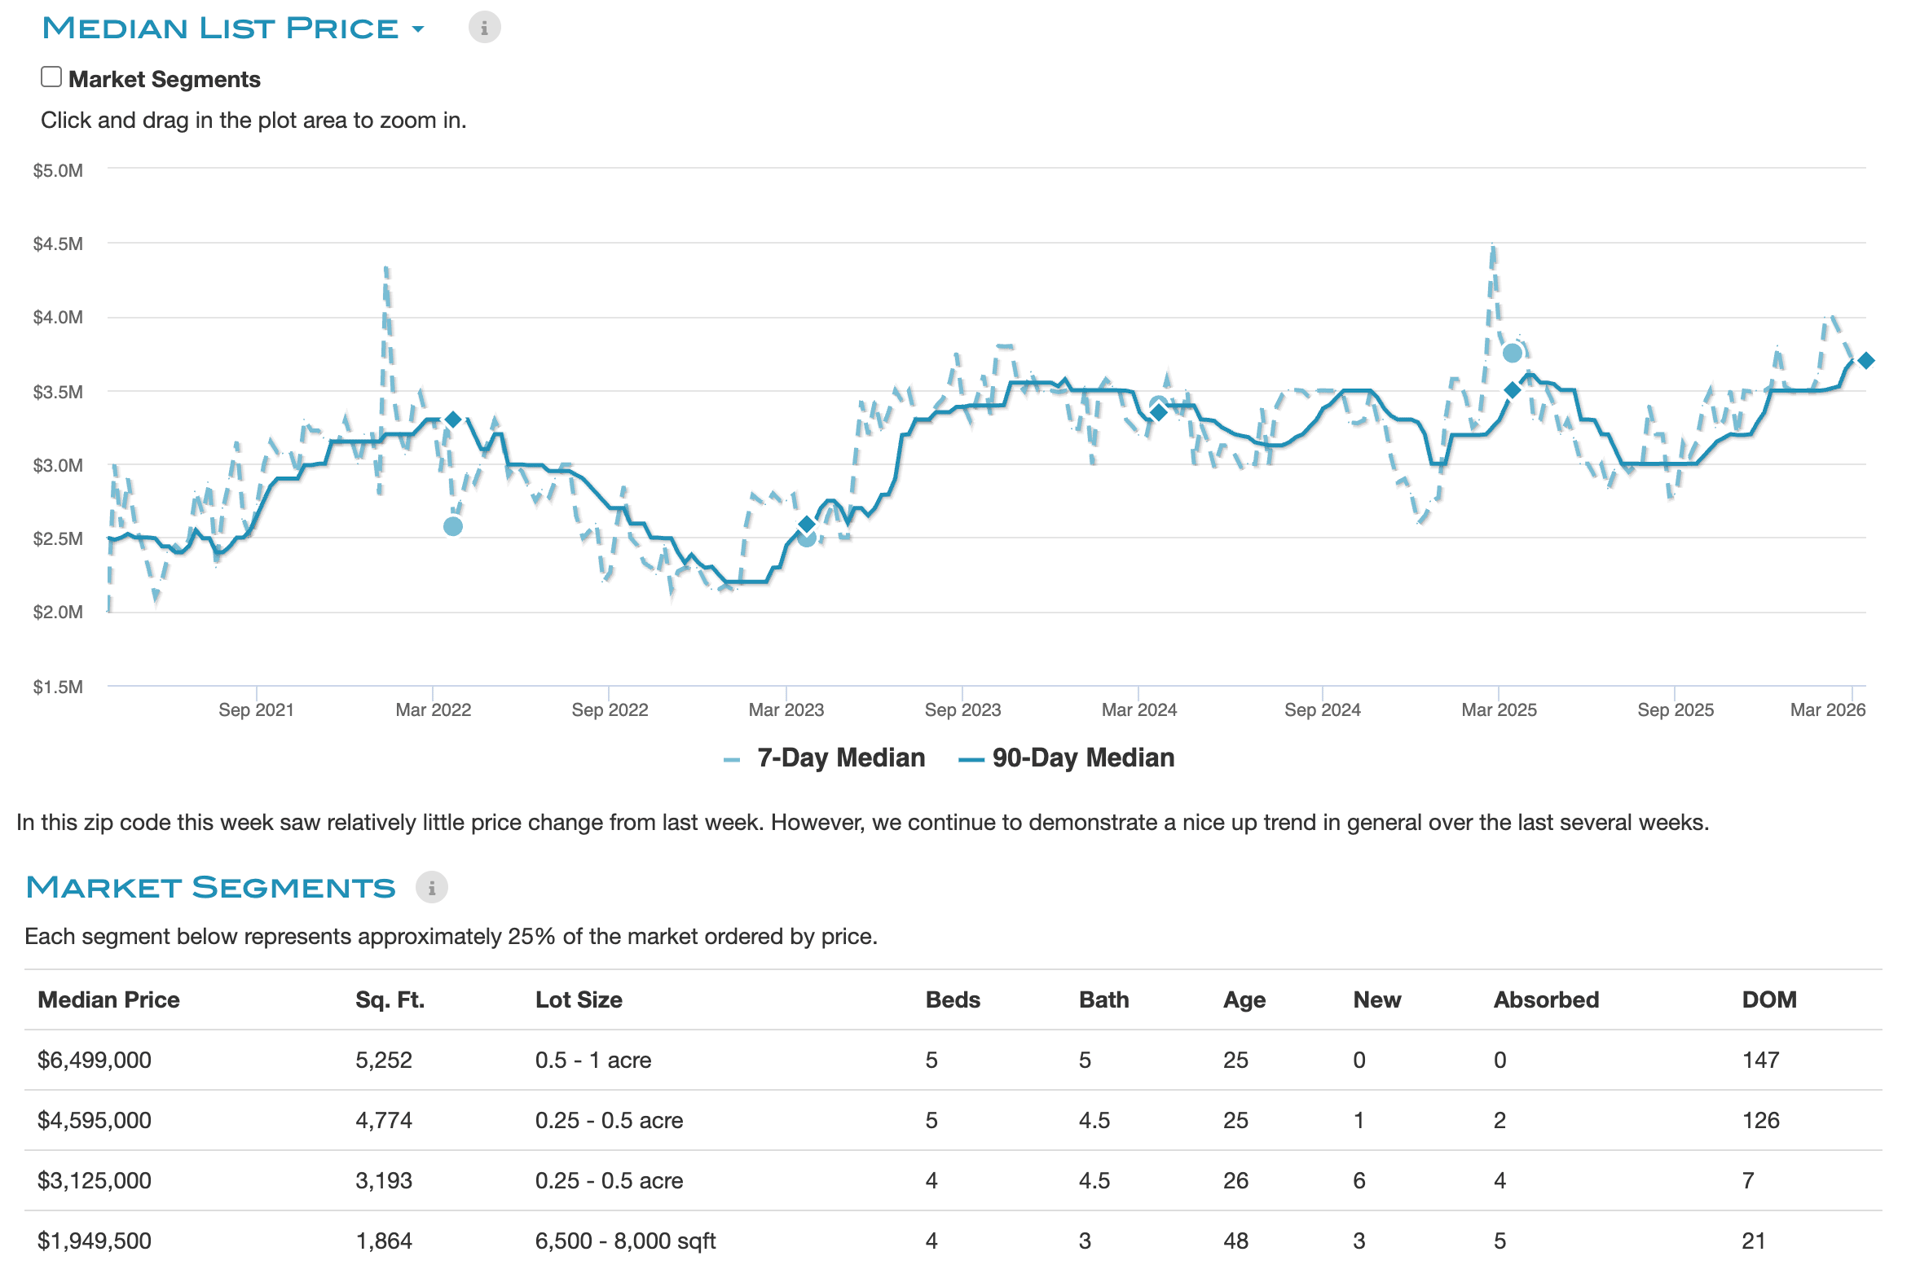
Market report chart comparing 7-day and 90-day median list prices, with a market-segment table below.
 
 
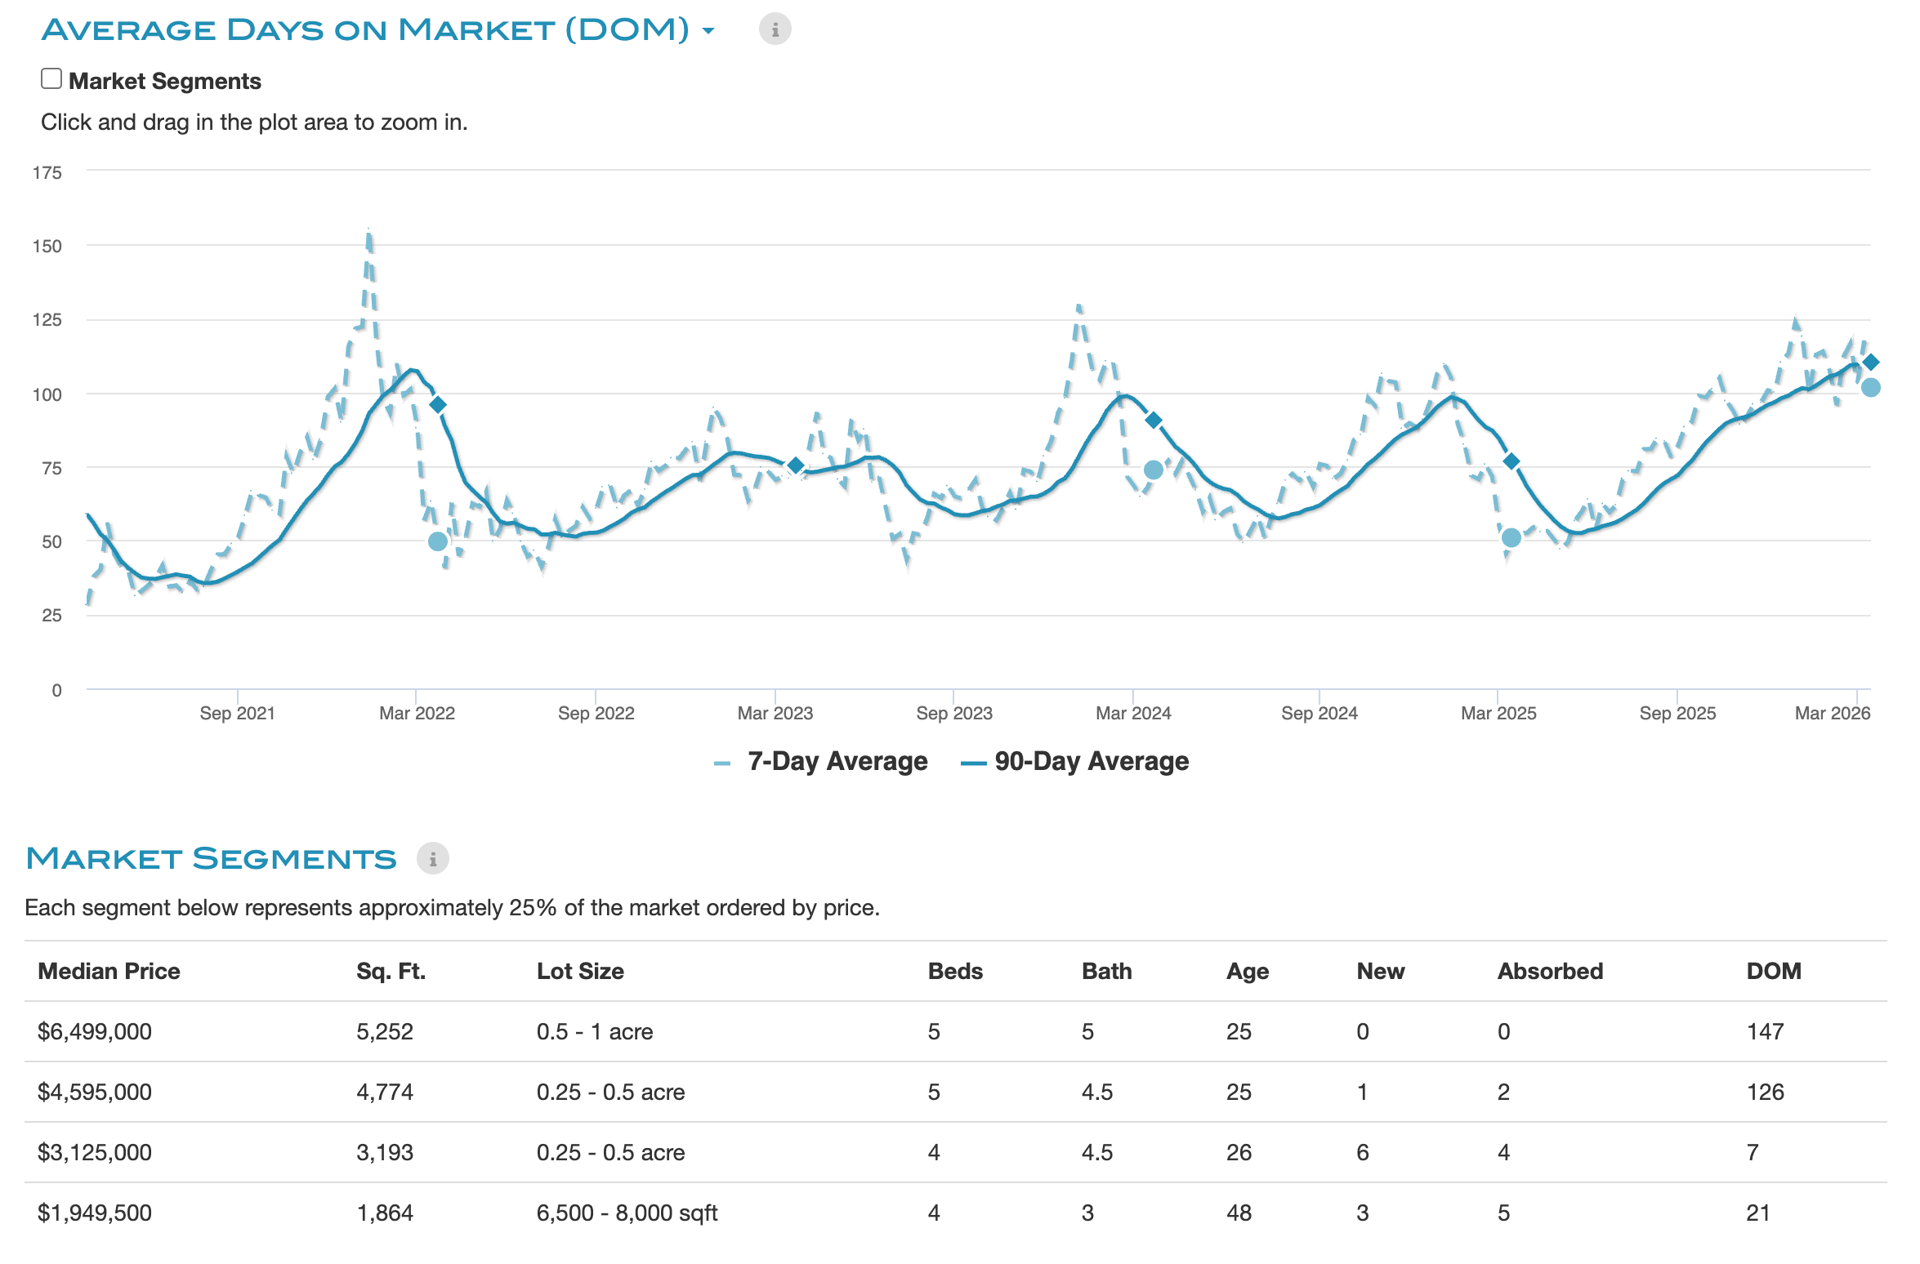
Solana Beach market report chart of average days on market, with 7-day and 90-day averages and market-segment data.
 
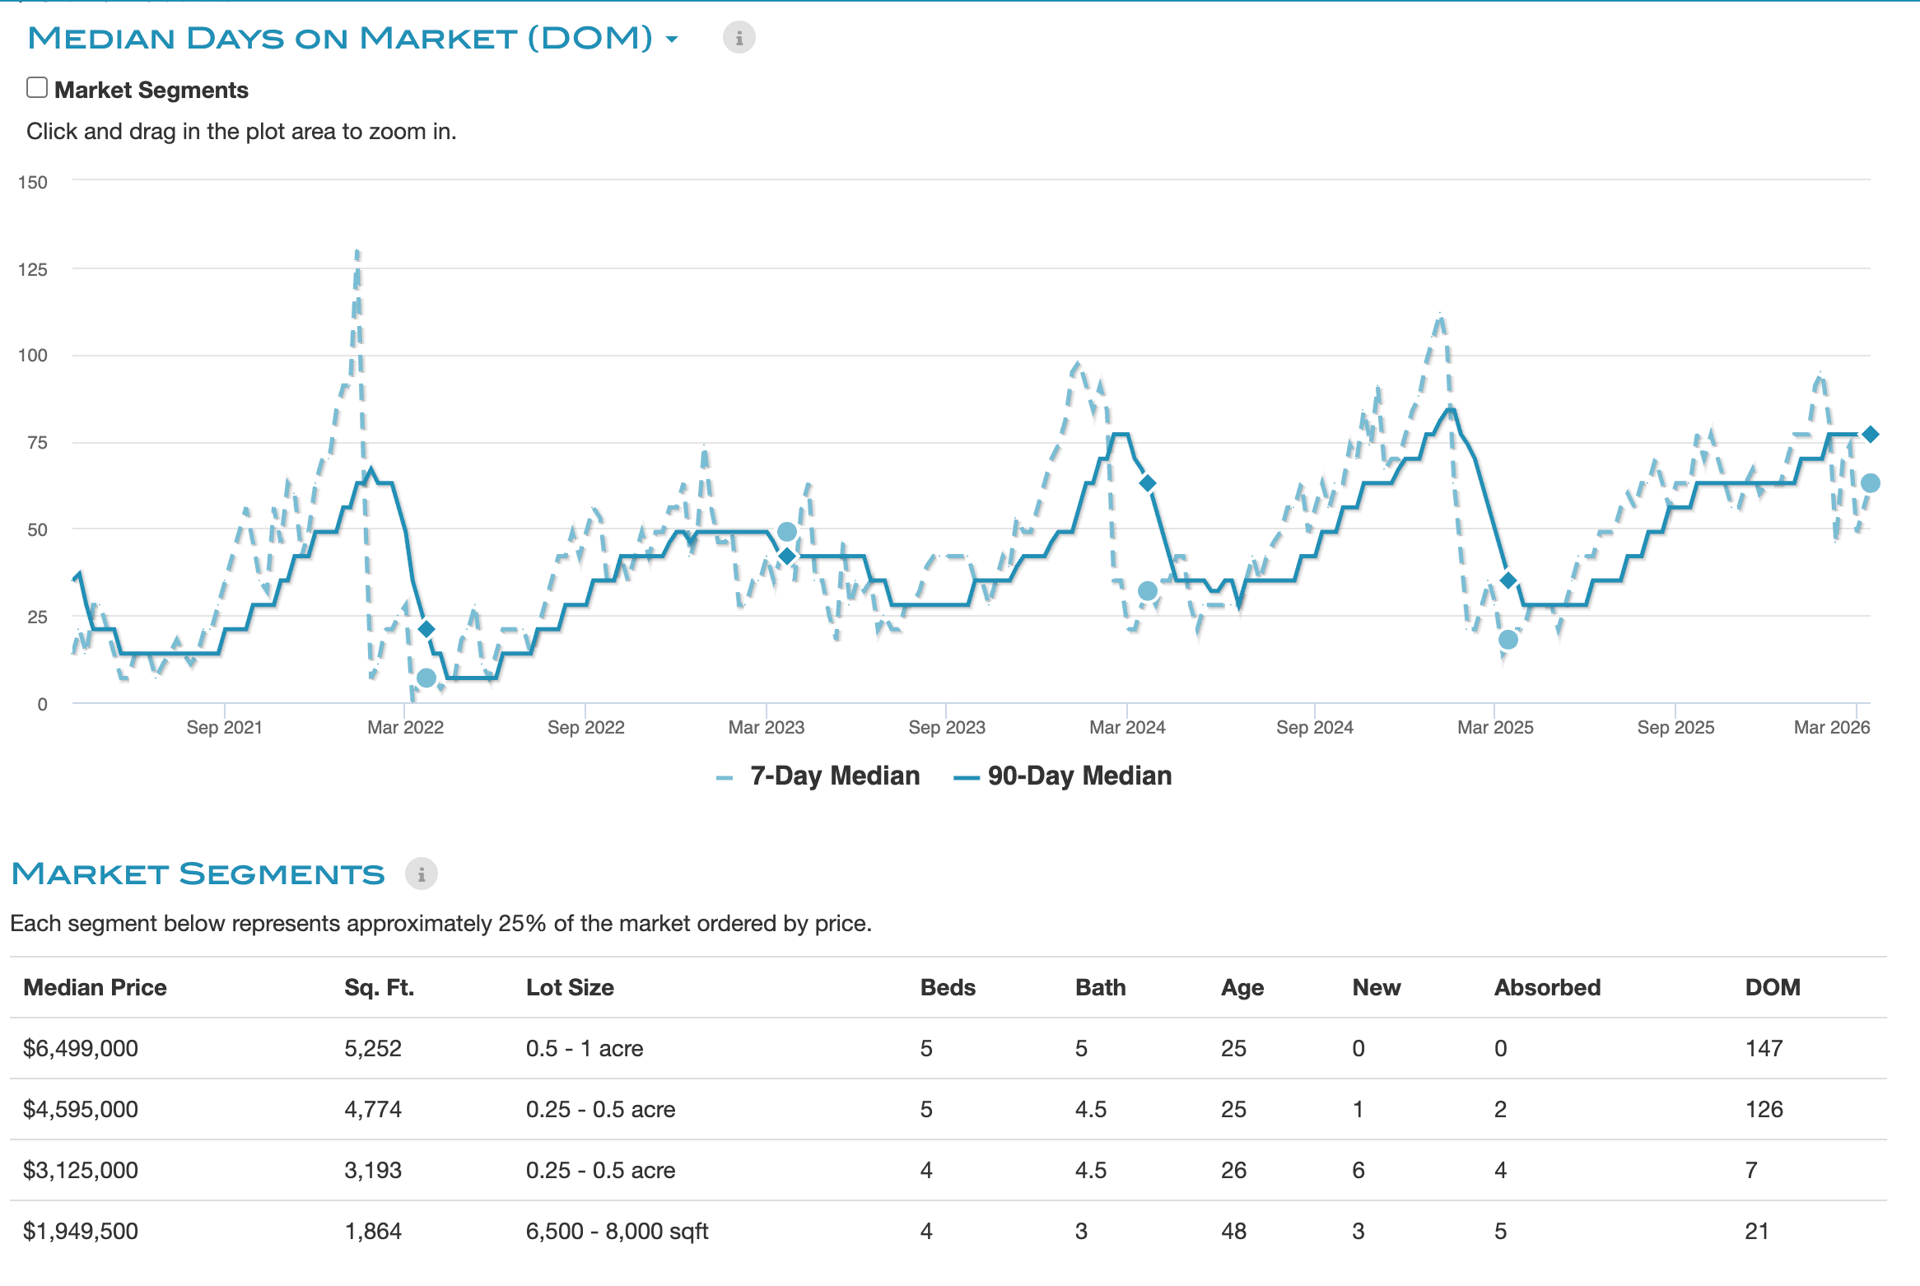
Market report chart comparing 7-day and 90-day days on market, with a market-segment property data table.
 
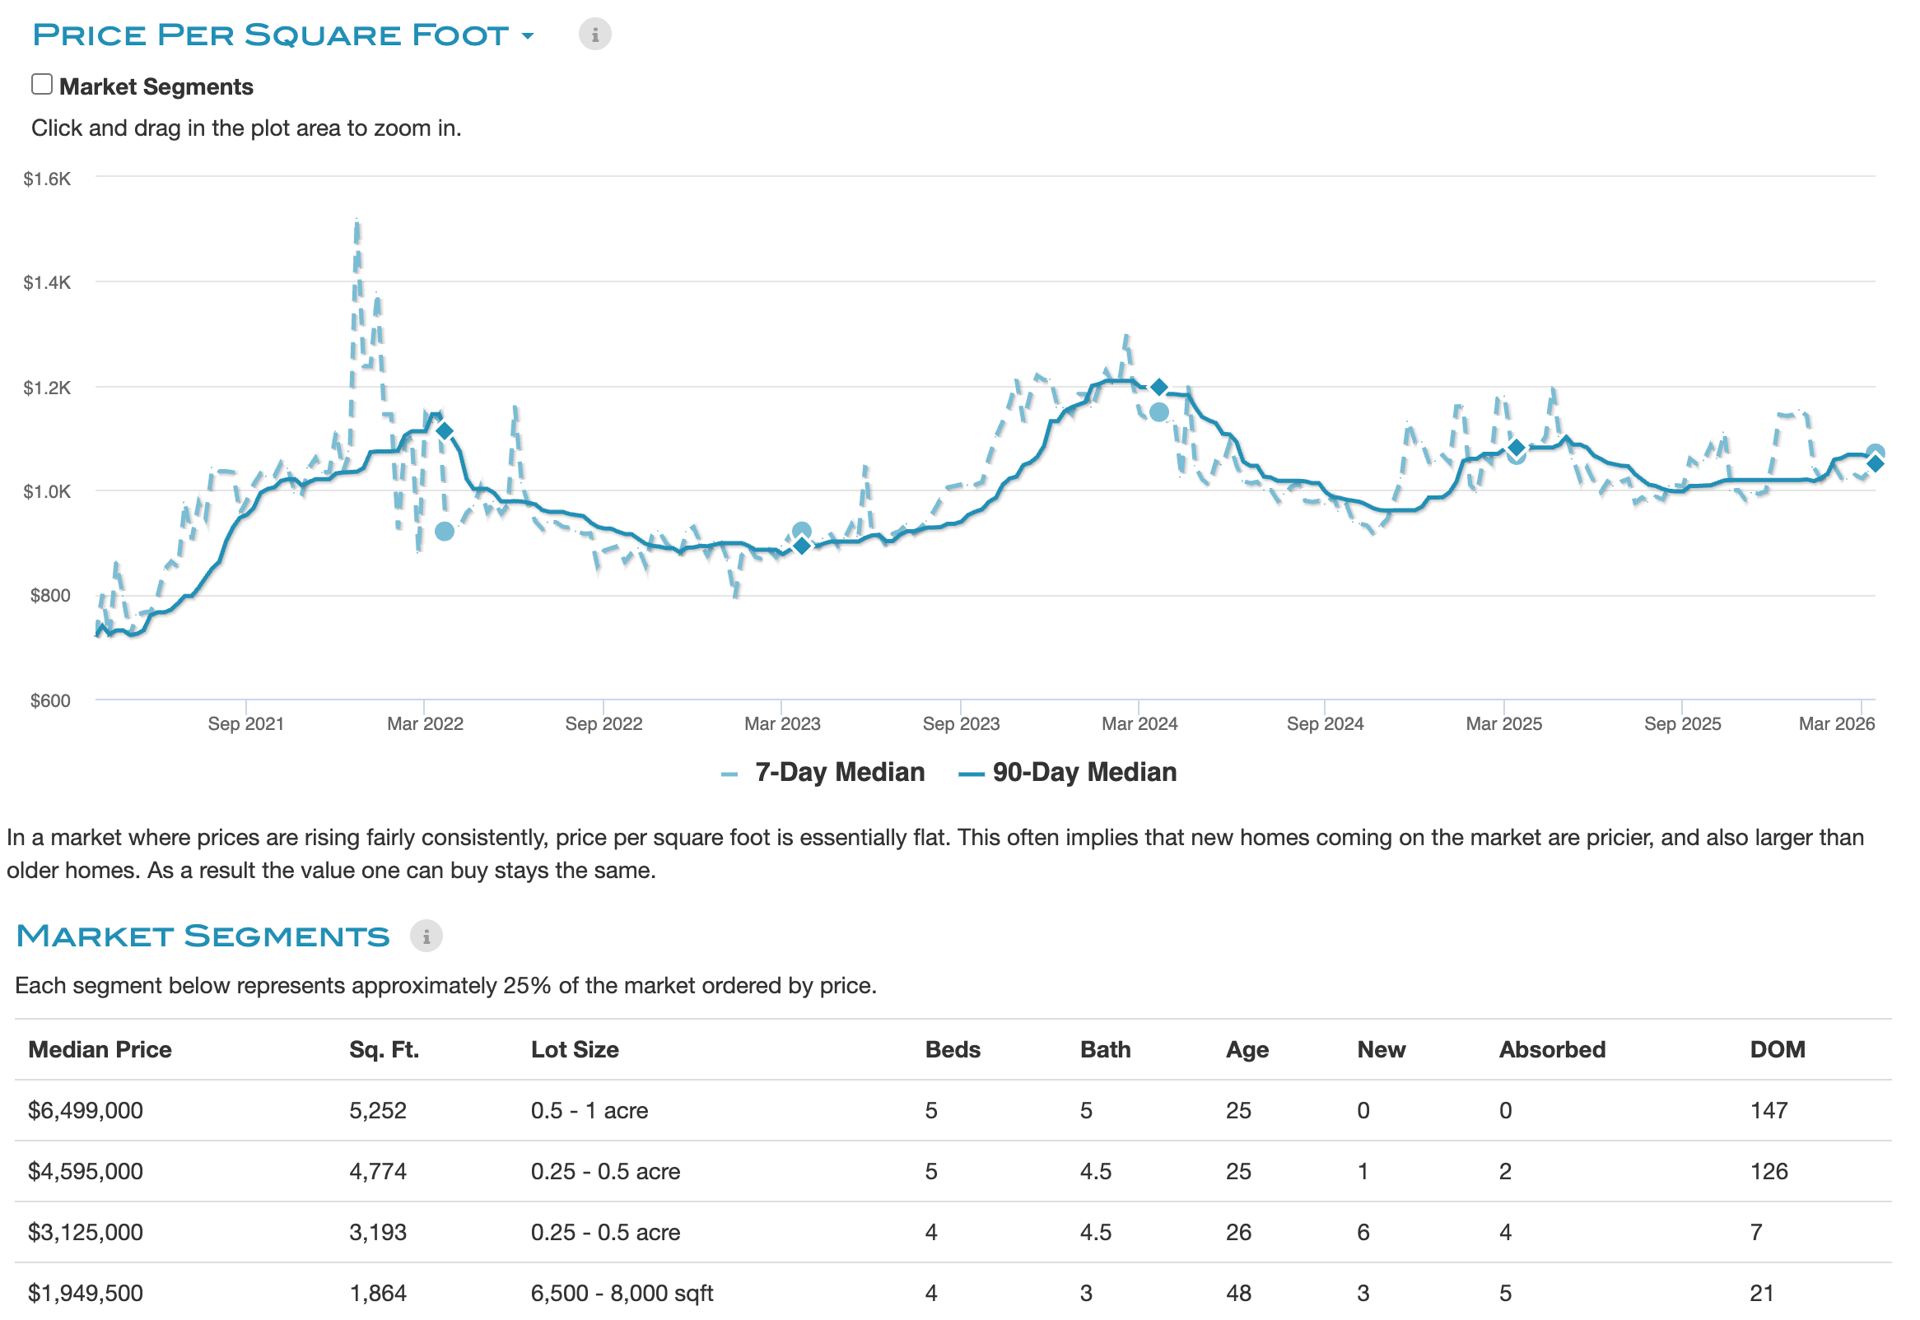
Solana Beach price-per-square-foot trends and market-segment statistics, 2021–March 2026.
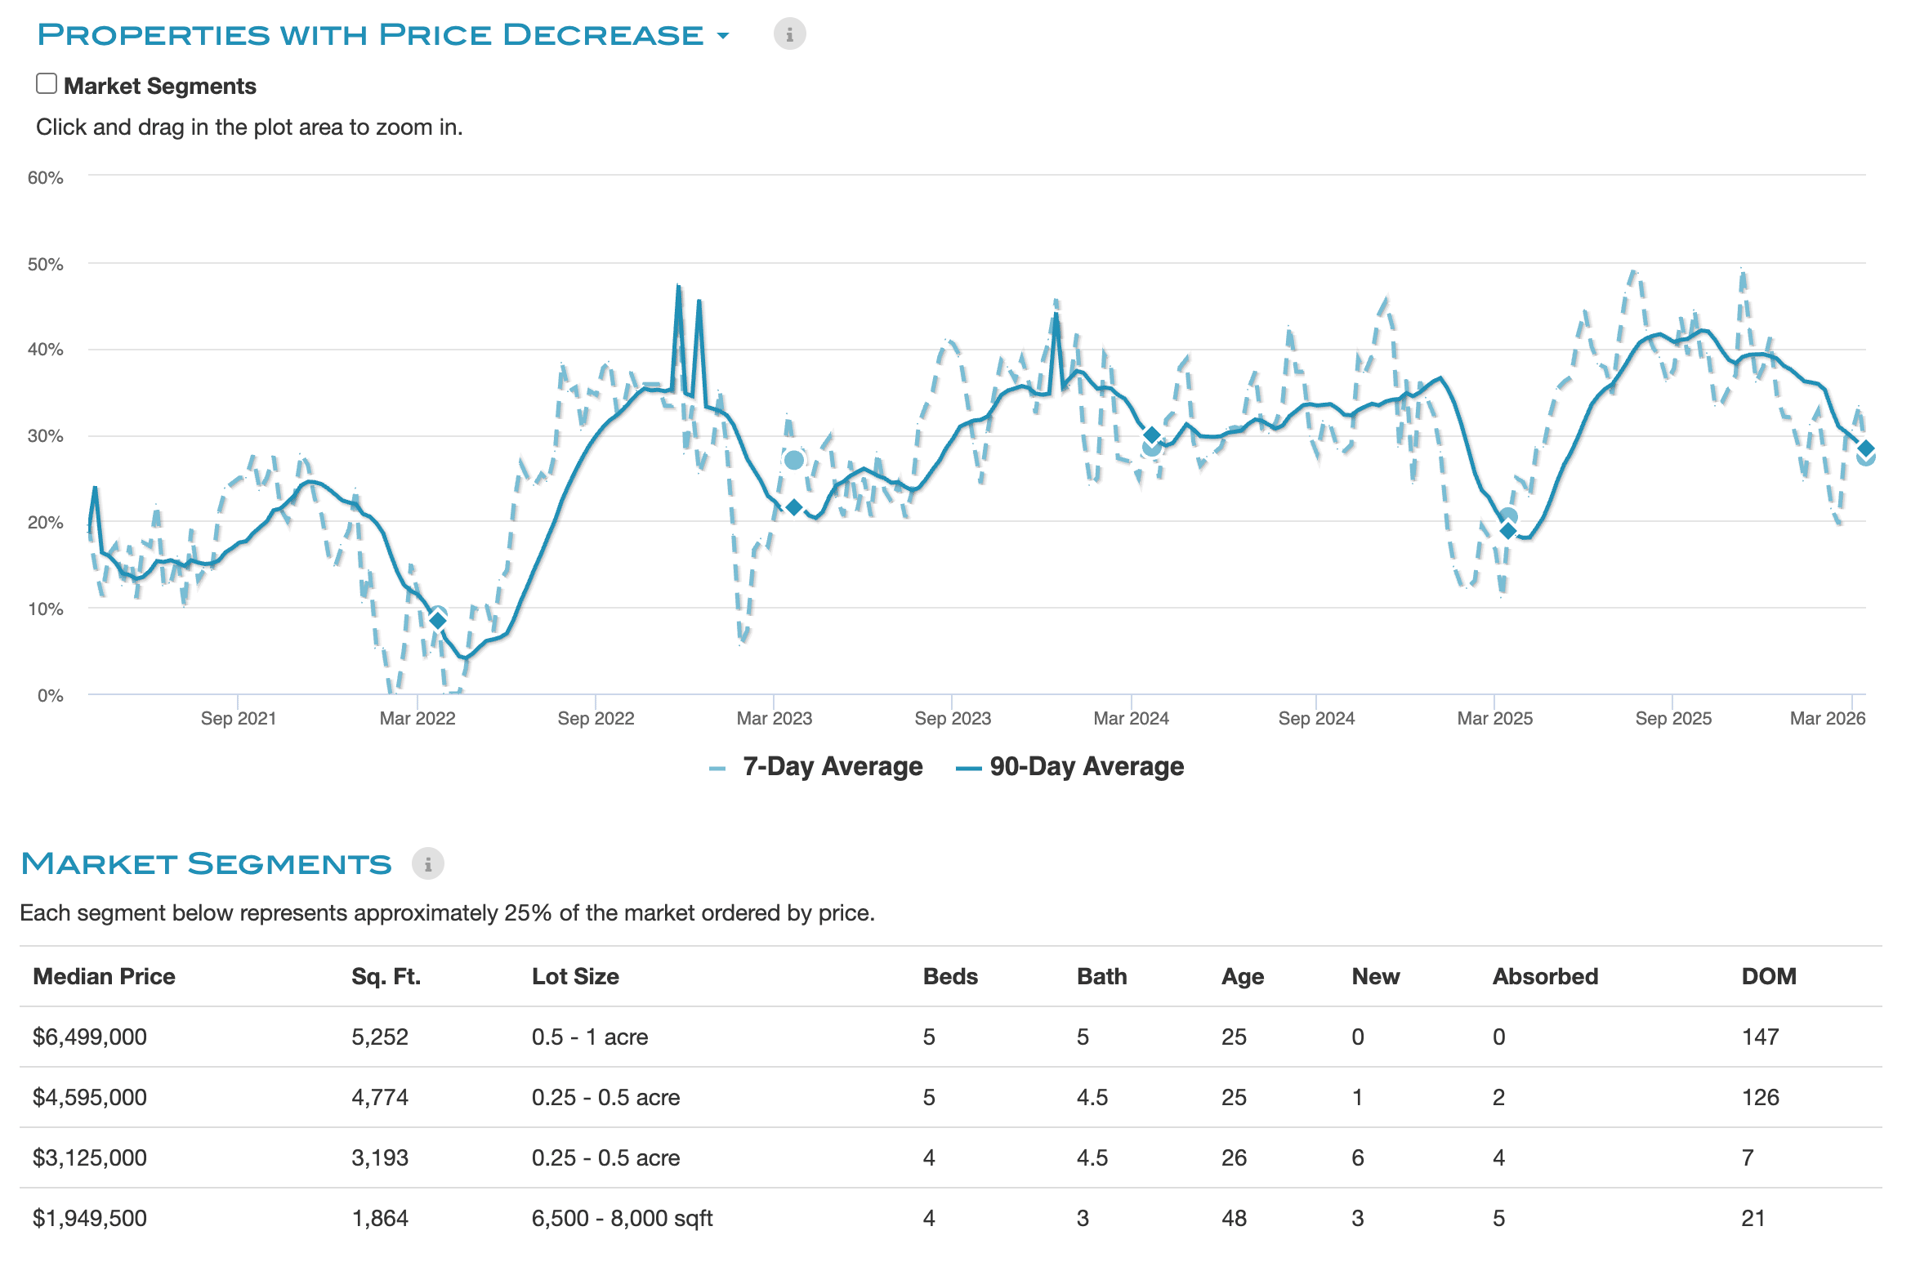
Market report chart of property price decreases and market-segment statistics from 2021 to March 2026.
 
 
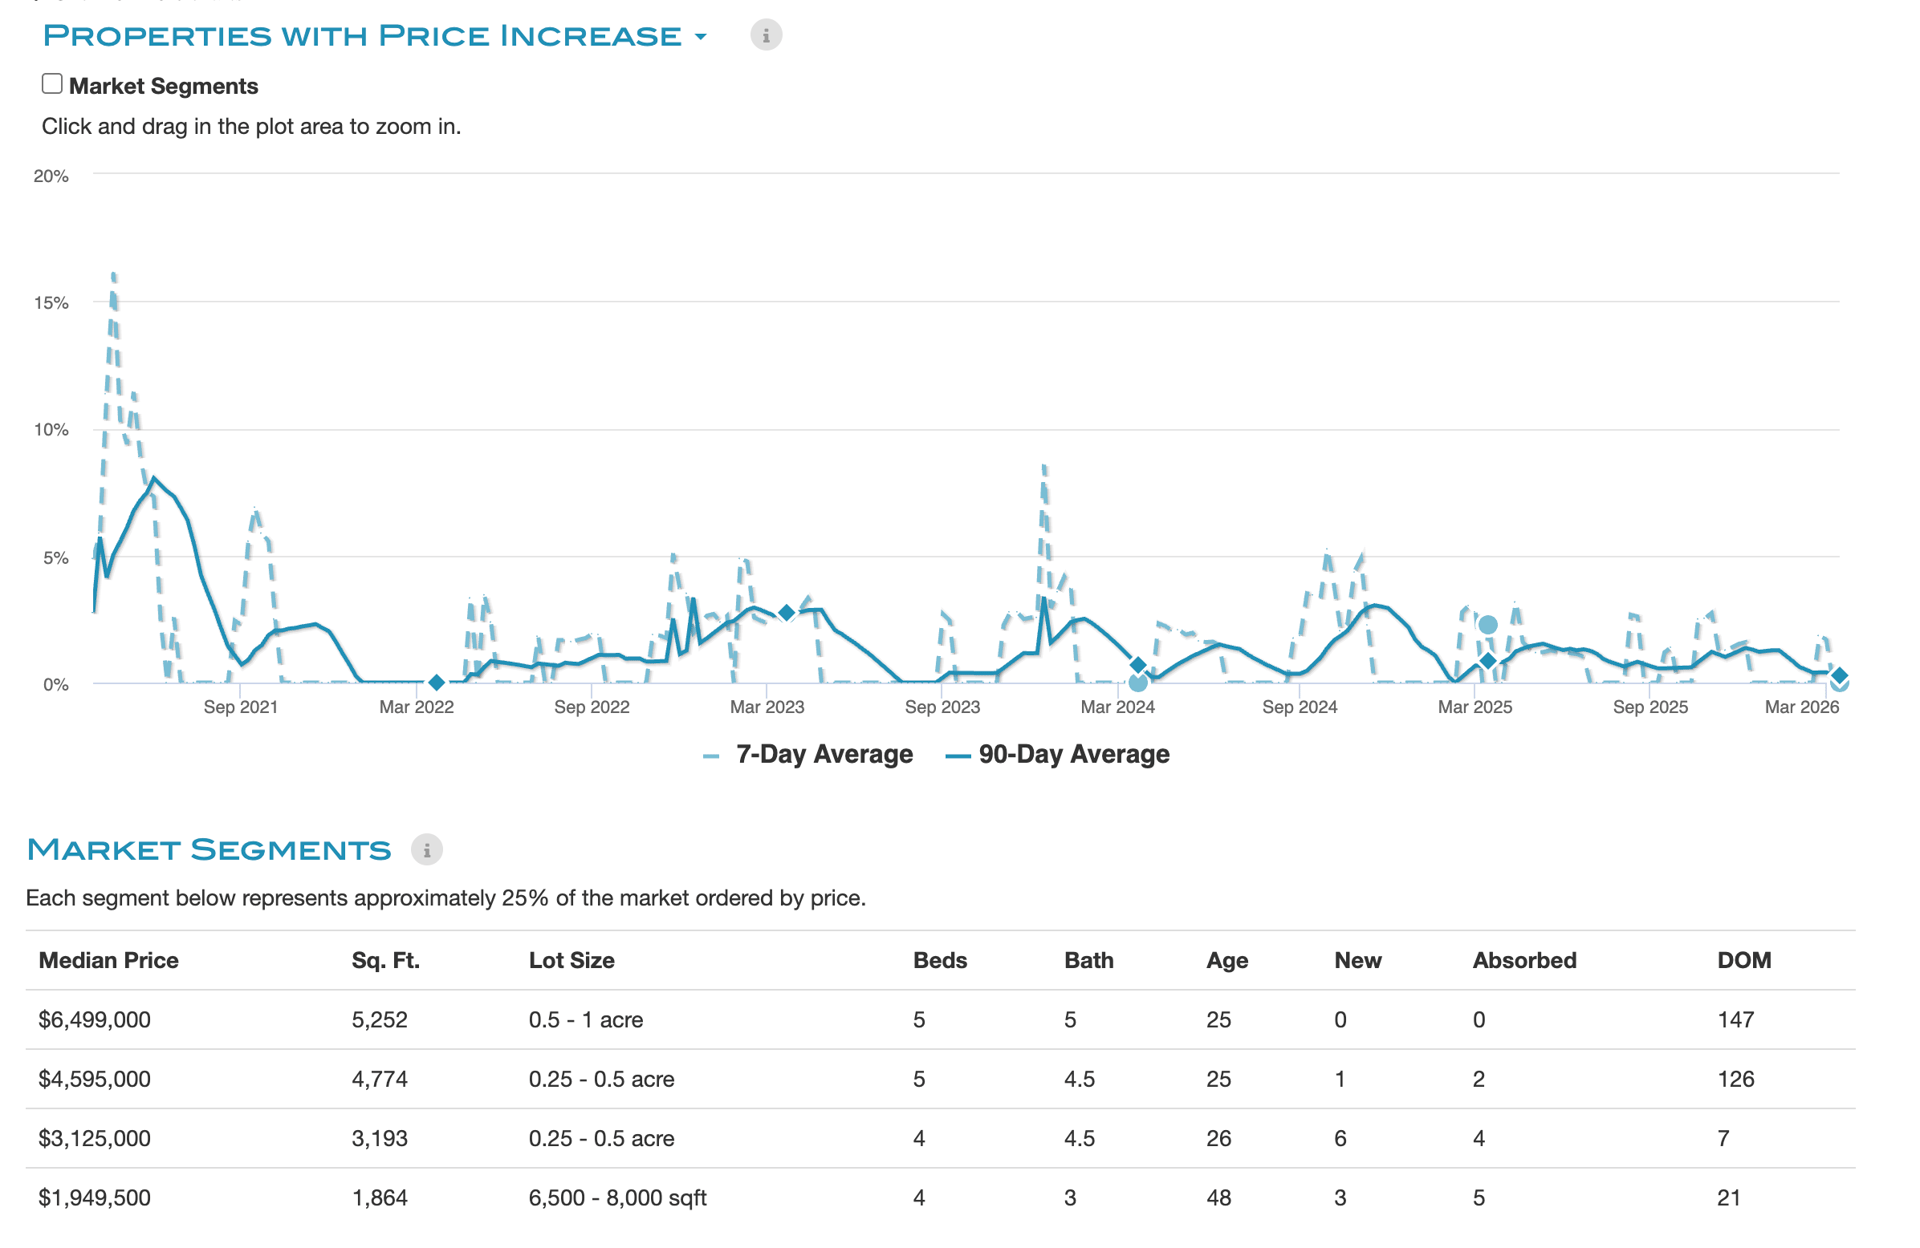
Market price increase chart with 7-day and 90-day averages and a table of property market segments.
 
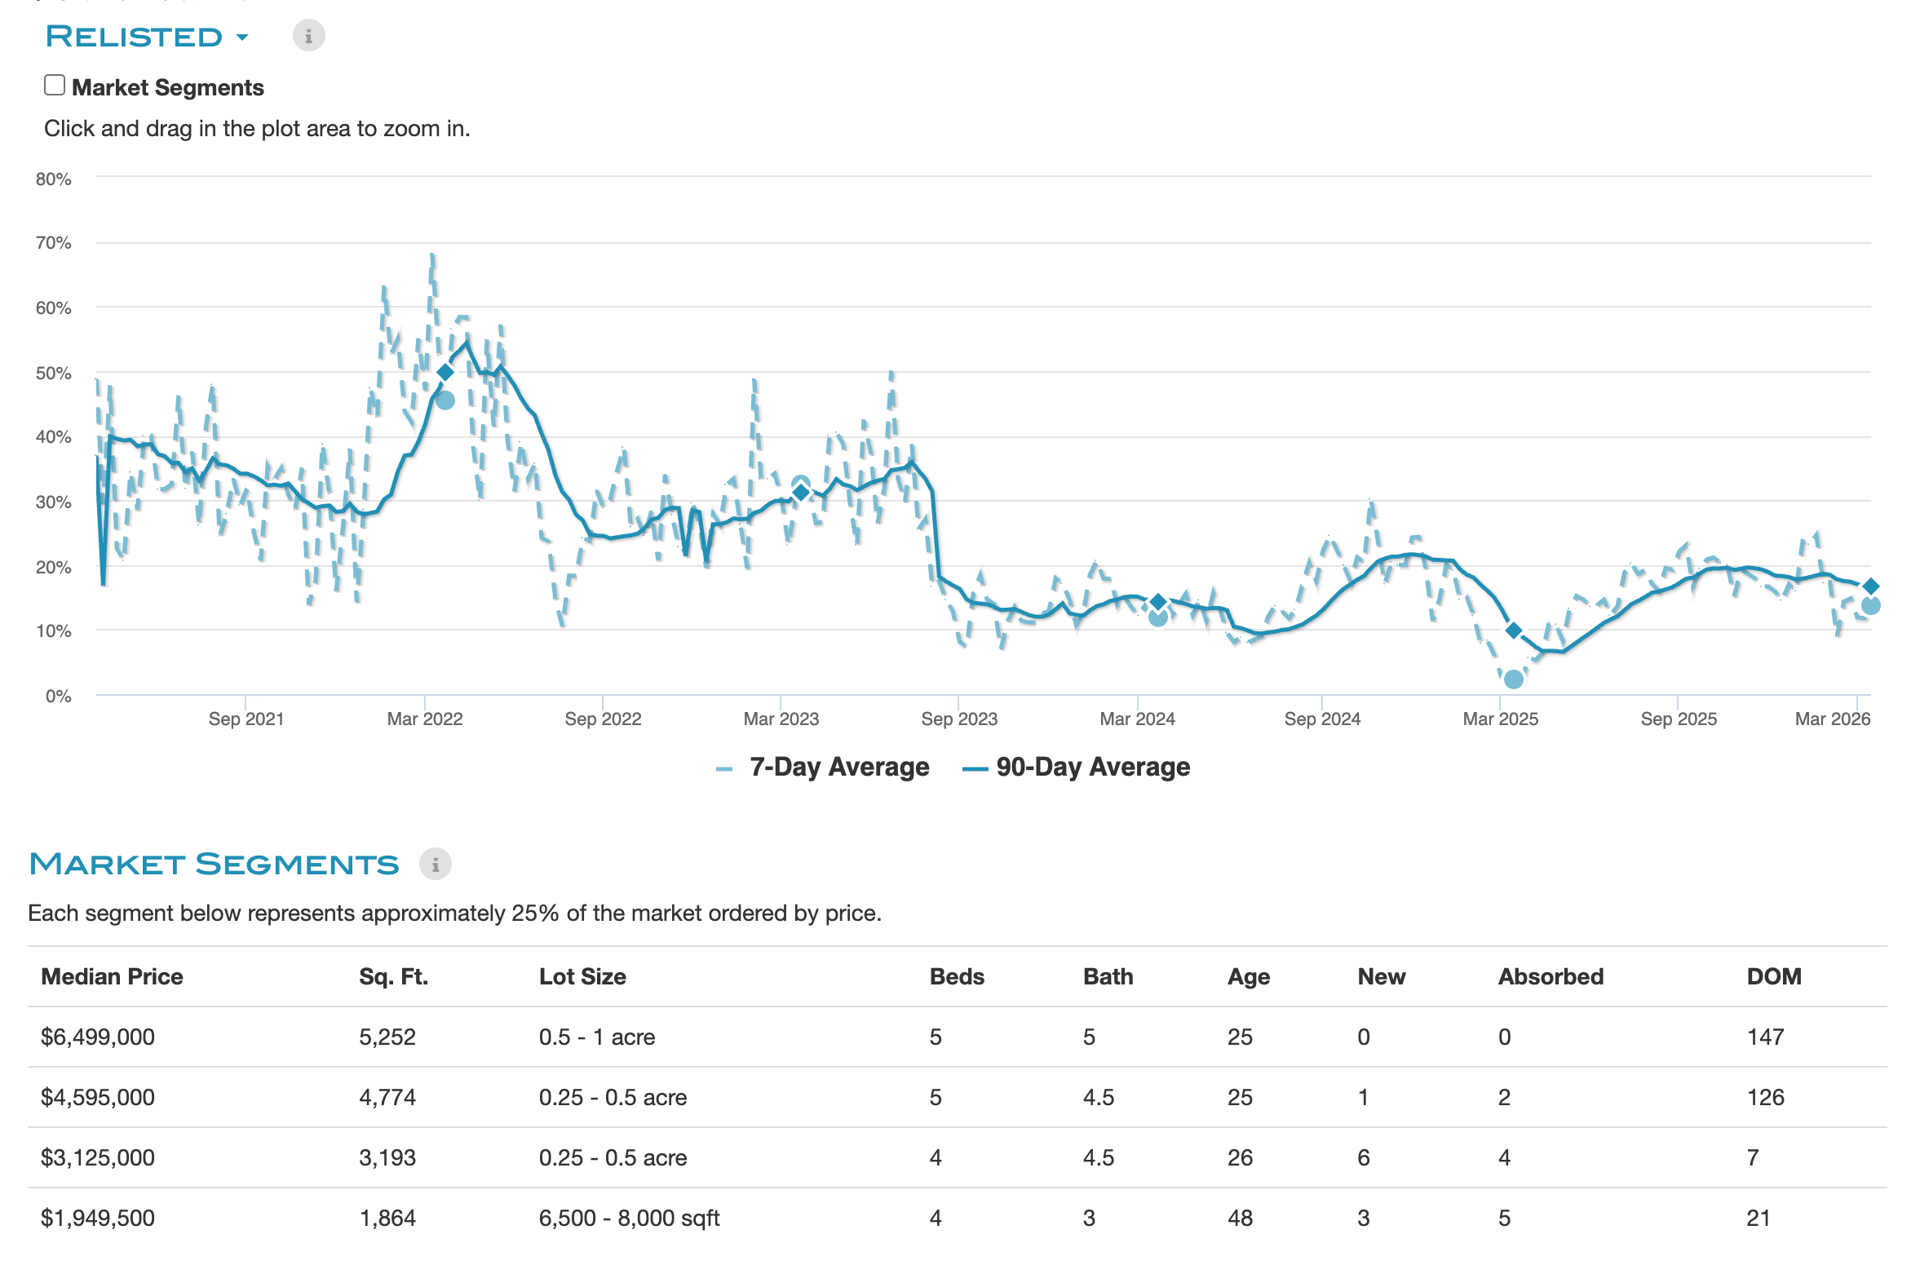
Market trend chart comparing 7-day and 90-day averages, with a market-segment table of prices and property statistics.
 
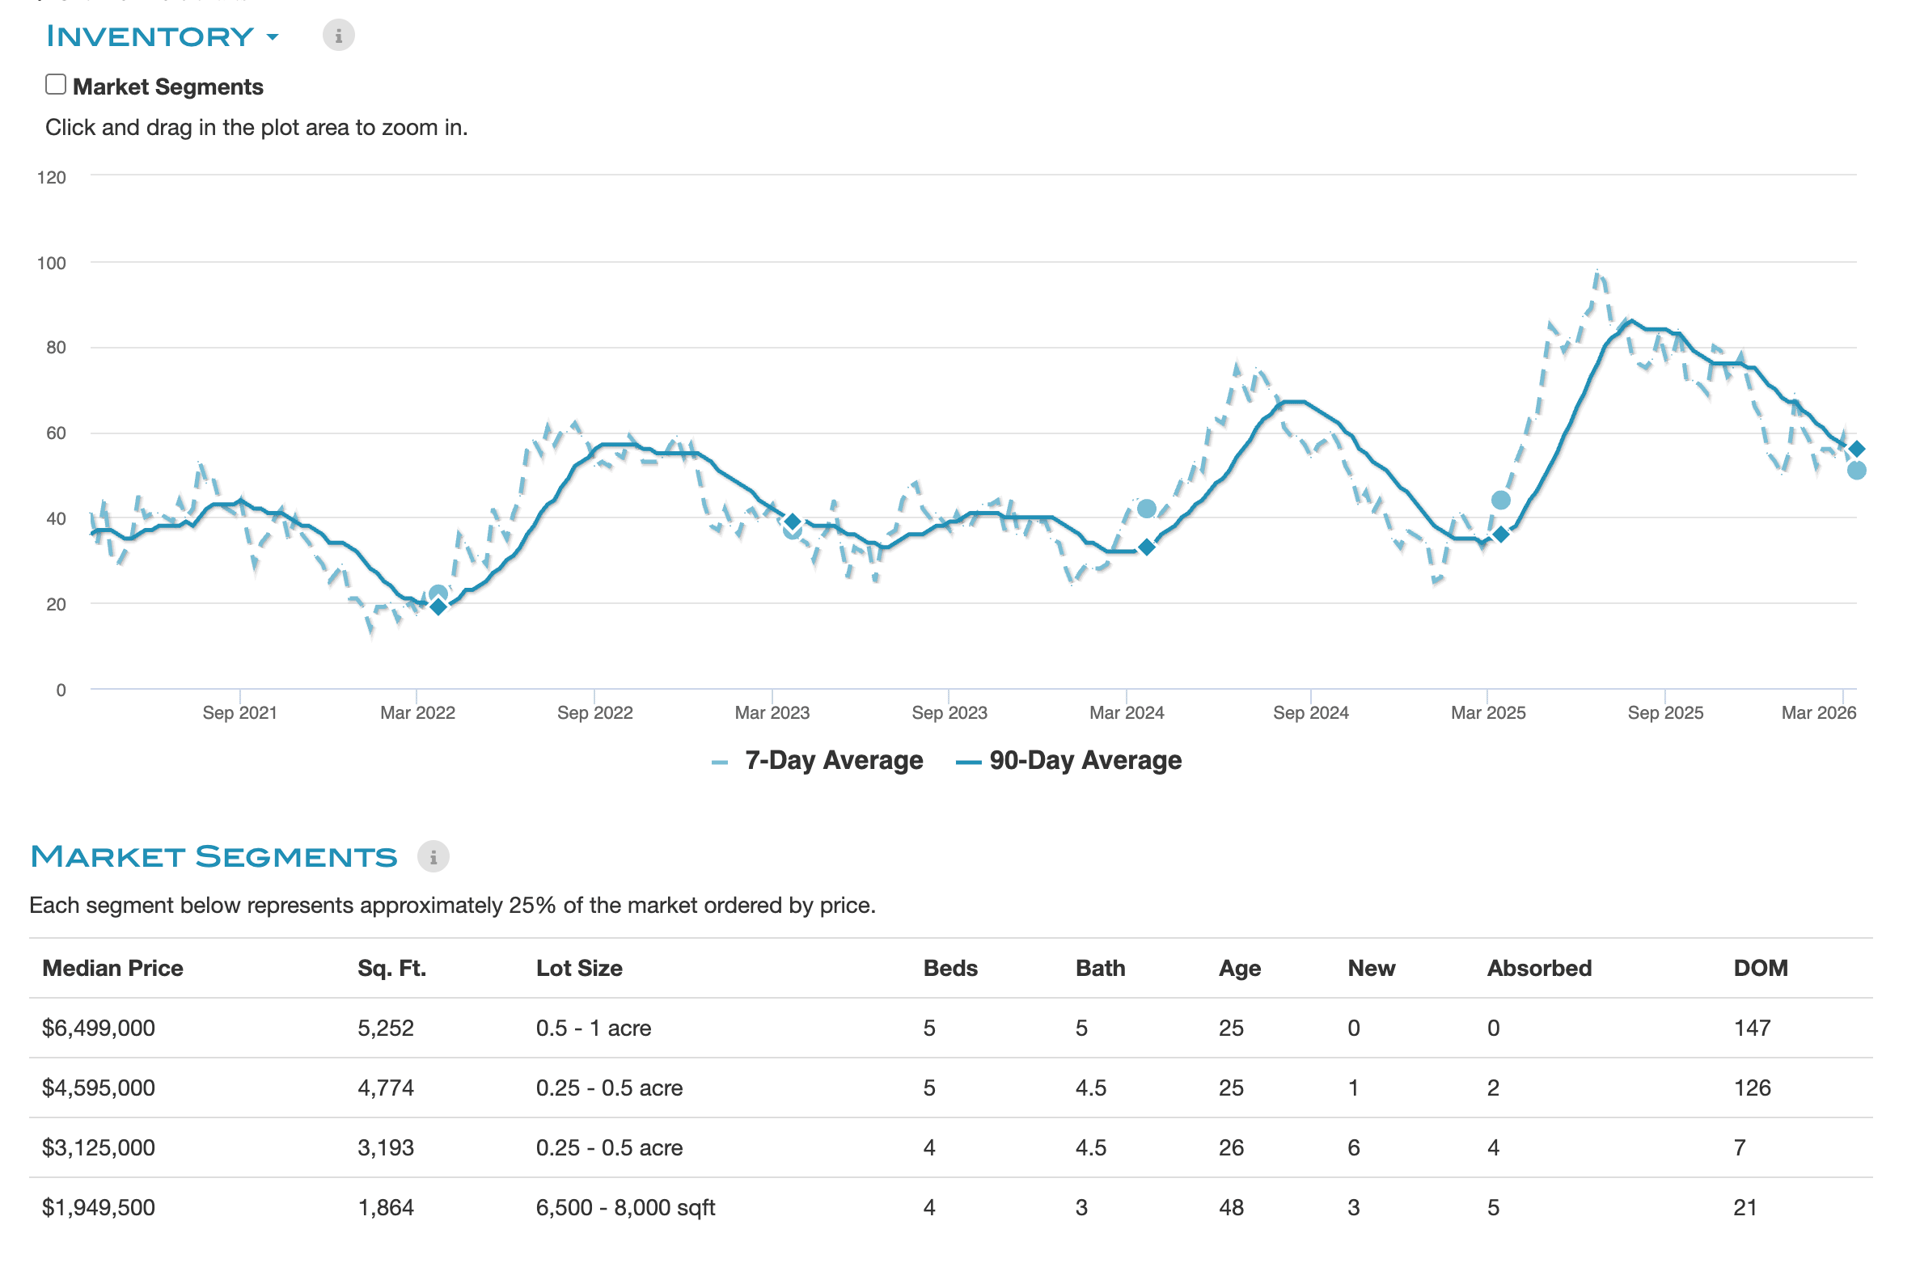
Inventory chart with 7-day and 90-day averages above a market-segment table of median prices and property statistics.

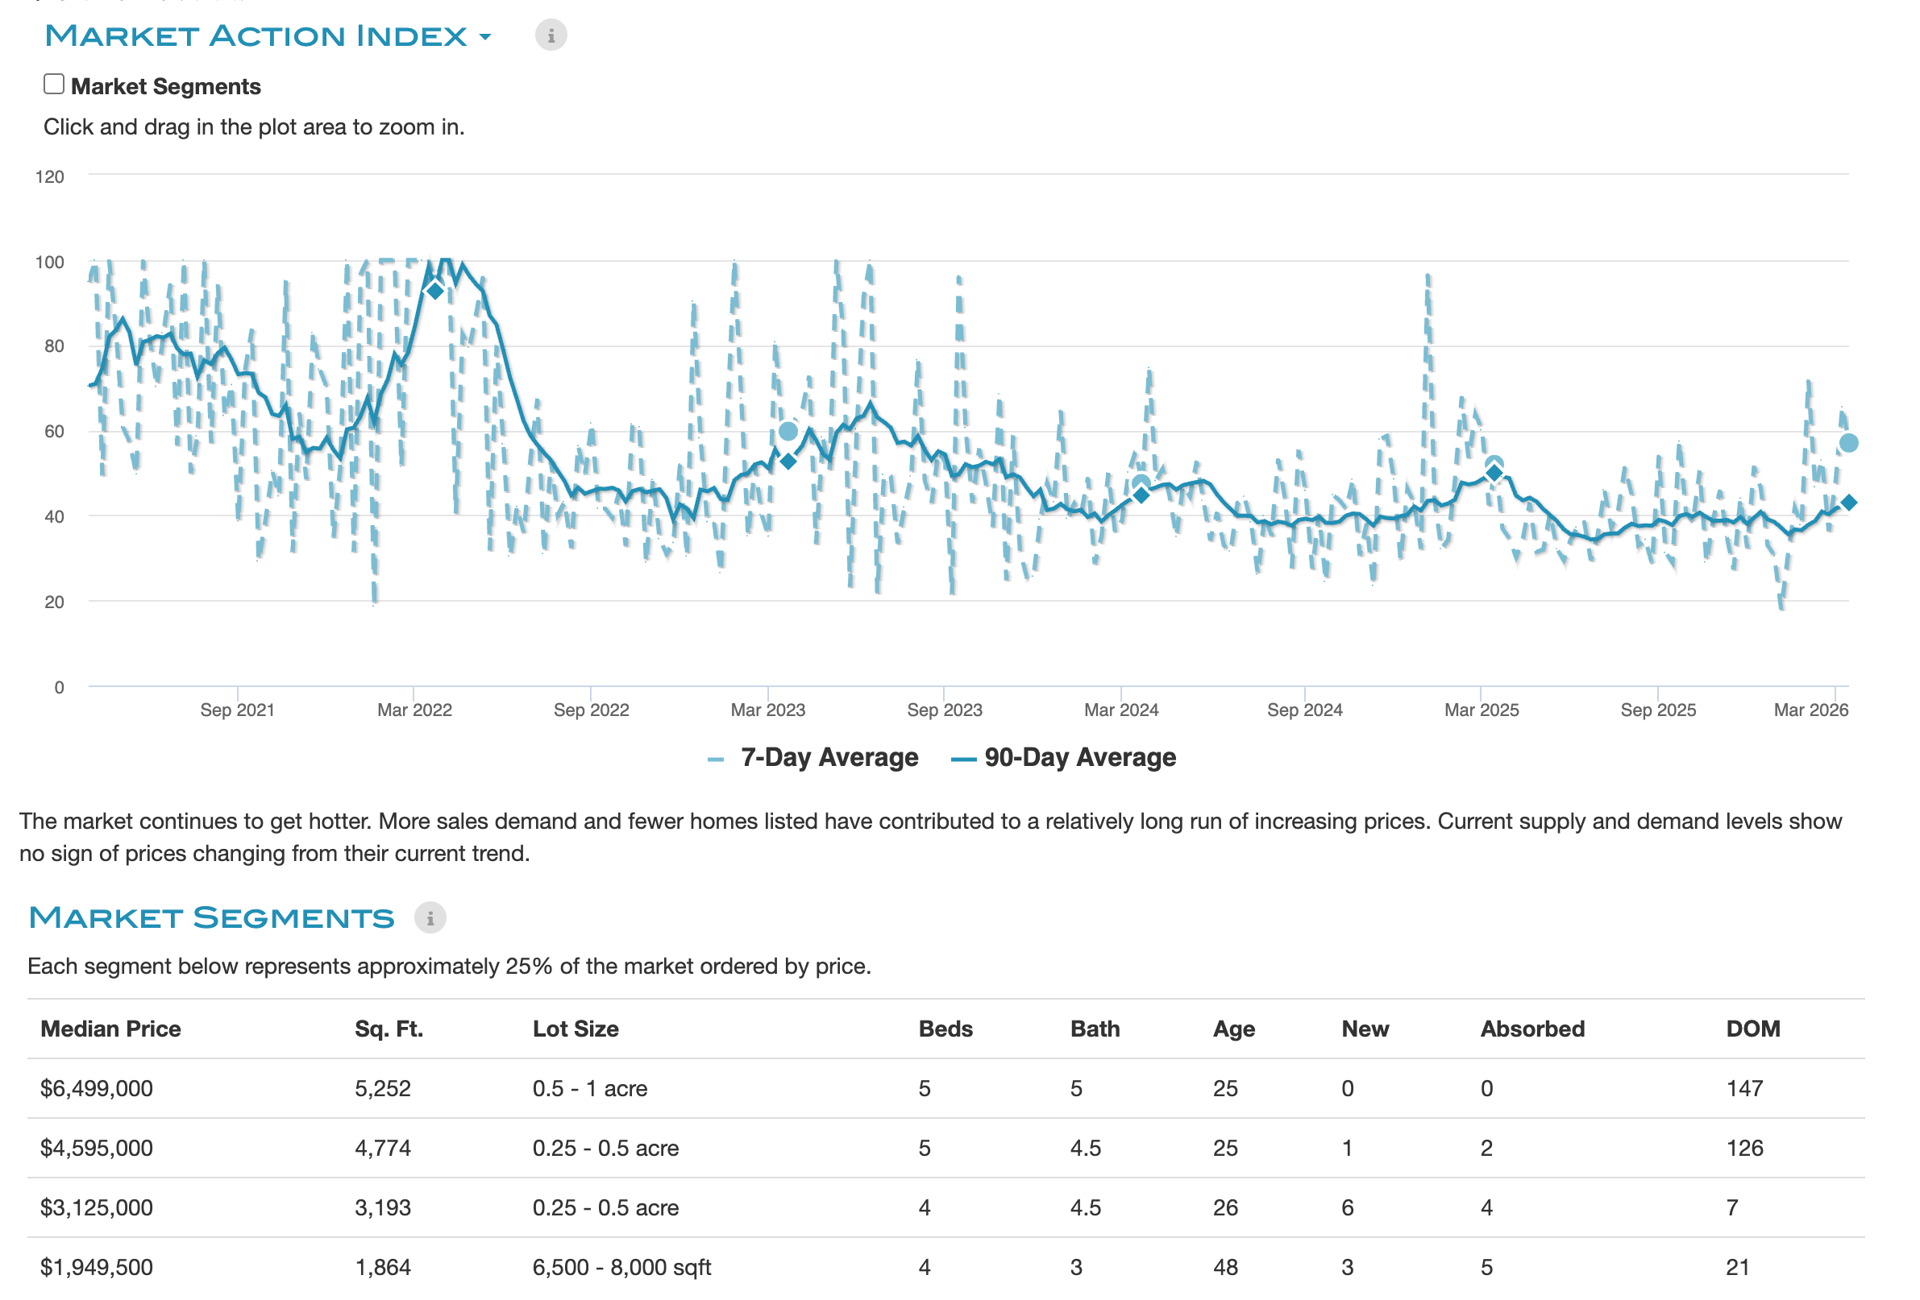
Solana Beach market report chart with 7-day and 90-day averages, commentary, and a market-segment statistics table.

Work With Sonja

Whether you are looking to sell your home, buy a home or learn about the prestigious communities of Rancho Santa Fe, La Jolla and Del Mar, Sonja Huter’s expertise in the San Diego real estate market is like no other real estate agent in the area.
Follow Sonja